Roads can be barriers to pedestrians because they are dangerous or unpleasant to cross. I explain this “barrier effect” in another page of this website.
I have developed a tool to forecast the result of reducing these barriers.
Let’s say we want to reduce the number of road lanes, or reduce speed limits, or add crossing facilities, or move the facilities 5 metres away. What is the result on the barrier effect on a scale from 0 to 100? How many pedestrians will stop crossing the road in unsafe locations? How many extra walking trips will be made that are nor made now? And what is the benefit of all this measured in terms of money?
My tool can answer these questions. Try it here.
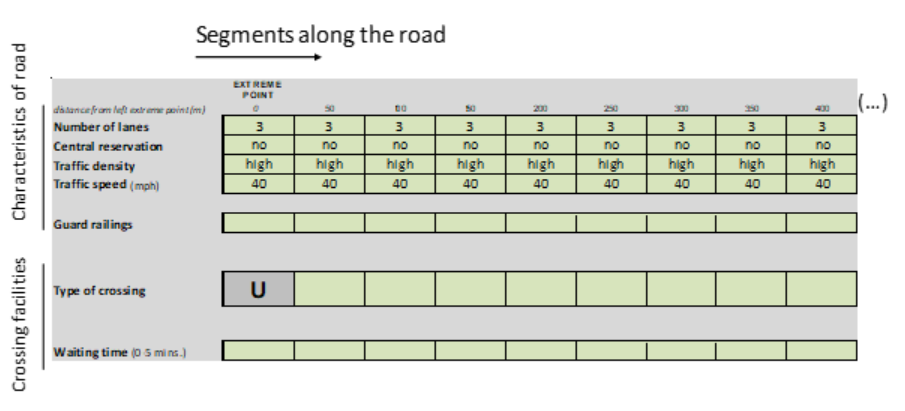
With the tool, we can play around with different road designs, and see the effects for pedestrians. The figure below shows an example of a road design. It shows, in each column, the various segments of a road. We can specify how each segment is like: the number of lanes, if it has a central resevation (median strip) or not, the traffic density and speed, if there are guard railings (physical barriers), and if there is any pedestrian crossing (and if yes, of what type).
For example, in the case below, in the extreme left side of the road, the road has 3 lanes, no reservation, high traffic density, and 40 mph speed. It also has an underpass (“U”).
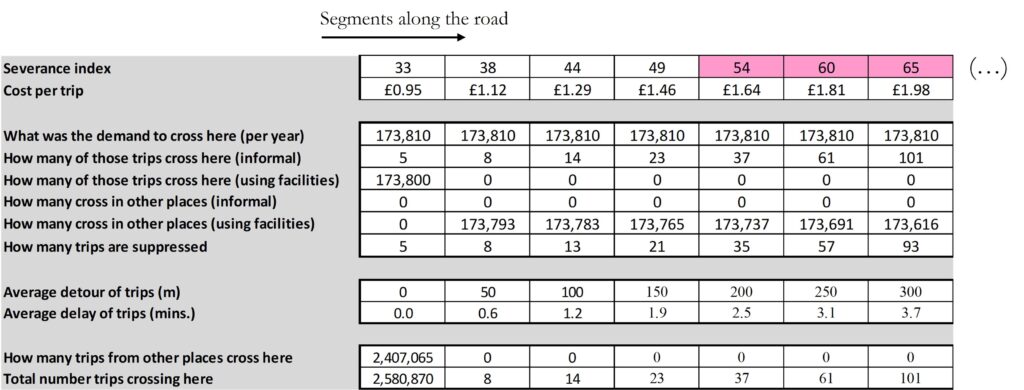
This is an example of one of the output pages of the tool. It shows, for the designed road, and in each segment, the level of the barrier effect (on a 0-100 scale), its cost in terms of money, the number of pedestrians crossing, the detour and delay for each walking trip, and other indicators.
In this example, the barrier effect grows as we move from the extreme left to the extreme right point of this road segment. This is because the road has the same conditions in all segments but the only crossing available is on the extreme left side. Other road designs would have different results.
Why is it important to know the value, in terms of money, of redesigning roads? Because decisions about transport policies, such as those affecting roads, often go through a cost-benefit analysis, i.e., quantifying the positive and negative impacts of the project as money. What is not quantified is appended to the analysis and described with words. But in practice, these non-monetised impacts tend to be “hidden”, as the key message is the benefit-cost ratio.
This new tool reduces this bias, by quantifying the benefits for pedestrians of policies to redesign roads.
The tool has instructions on how it can be used. A more technical explanation of the development of the tool is in this paper.
Next resource: Street Mobility Toolkit