In 2018-2022, I worked in the MORE project. This was a project funded by the European Union to find solutions for the allocation of urban streetspace. Read more about this problem in Example 2 in this page of this website.
As a part of the project, I developed tools to generate solutions that balance the needs of all street users, while meeting broader economic, social, and environmental aspects.
Let’s imagine we want to improve conditions for pedestrians but without making bus users worse off than they are now. And at the same time reducing emissions and improving the local economy. My tools give a list of solutions, backed by scientific evidence.
The tools are available from the International Federation of Pedestrians website.
Streetspace Interventions Tool
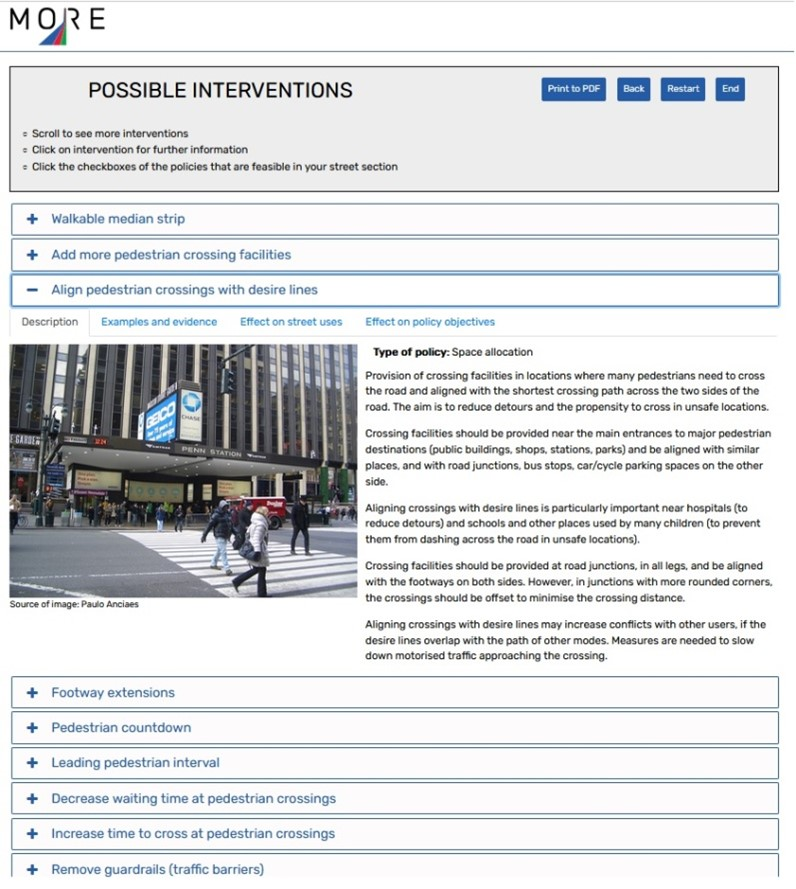
This tool generates solutions to regulate, reallocate, or redesign streetspace. The tool user specifies the objectives to meet (example: improve conditions for pedestrians without making bus users worse off). The tool returns solutions that have worked elsewhere or could work, based on the results of studies. The tool user can then see detailed information about every solution.
See an example below. The tool returns several solutions. We can click on any of these solutions (in this example “Align pedestrian crossings with desire lines”) and see a description of the policy, with photos, examples around the world, scientific evidence of the results of this solution, and then the likely effect of the solution on 28 different types of street users and 28 policy objectives.
Street Designs Tool
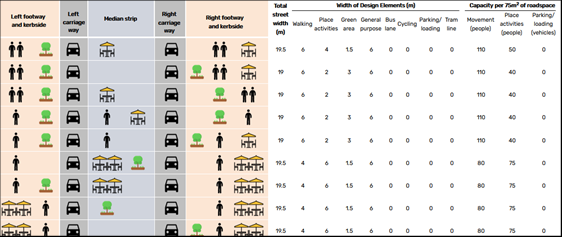
This other tool generates street designs, in cross section. The designs fulfil the criteria filled by the tool user (e.g., more space for pedestrians without removing space for buses) while also fitting into the available street width. See an example of the tool’s output below.
Each row is a possible design. All designs fit into the available street width (20m). The left side of the page shows the elements that are included in the design, and their positions, across the street. The right side of the page shows the total width allocated to each type of element, and the capacity of the street for movement (number of people), “place” (people sitting in outdoor cafés), and parking and loading.
For example, the first possible design has a medium-size pedestrian area and trees on the left-side footway, one lane for general trafic in the left carriageway, one area with outdoor cafés in the median strip, one lane for general traffic in the right carriageway, and a medium-sized pedestrian area and another area with outdoor cafés in the right-side footway. This design occupies 19.5m, 6m of which is for walking, 6m for the movement of traffic, 4m for outdoor cafés, and 1.5m for trees. 100 people can move, and 50 can sit per each 75m2 of street space.
Further information
The tools were applied in five European cities: London, Lisbon, Malmö, Budapest, and Constanta. The case of Lisbon is reported in this paper. More details about the development of the tools can be found in this paper.
Next resource: Community Severance Valuation Tool