Question: Who benefits and who suffers from transport?
Equity is a subjective concept. It is not the same as equality. It’s closer to fairness and justice. For me, it is what justifies departures for equality: for example giving priority to someone because they are more vulnerable or at some sort of disadvantage. Inclusion is related to equity, but is easier to define: giving priority to someone because otherwise they might not have the opportunity to participate fully in society. Equity and inclusion apply to transport. Here are three examples, from my research.
Example 1: distribution of transport positive and negative effects
In my PhD, I used maps to see if some groups were at disadvantage in the distribution of both the positive effects and negative effects of transport. For example, if they had, on average, less accessibility (by car or public transport) to jobs and other places, and at the same time, had higher exposure to noise caused by transport. Most previous studies had only looked at each of these aspects in isolation.
I found that, on average, noise affected vulnerable groups such as low income households and older people. But these groups did not have lower accessibility than others, on average.
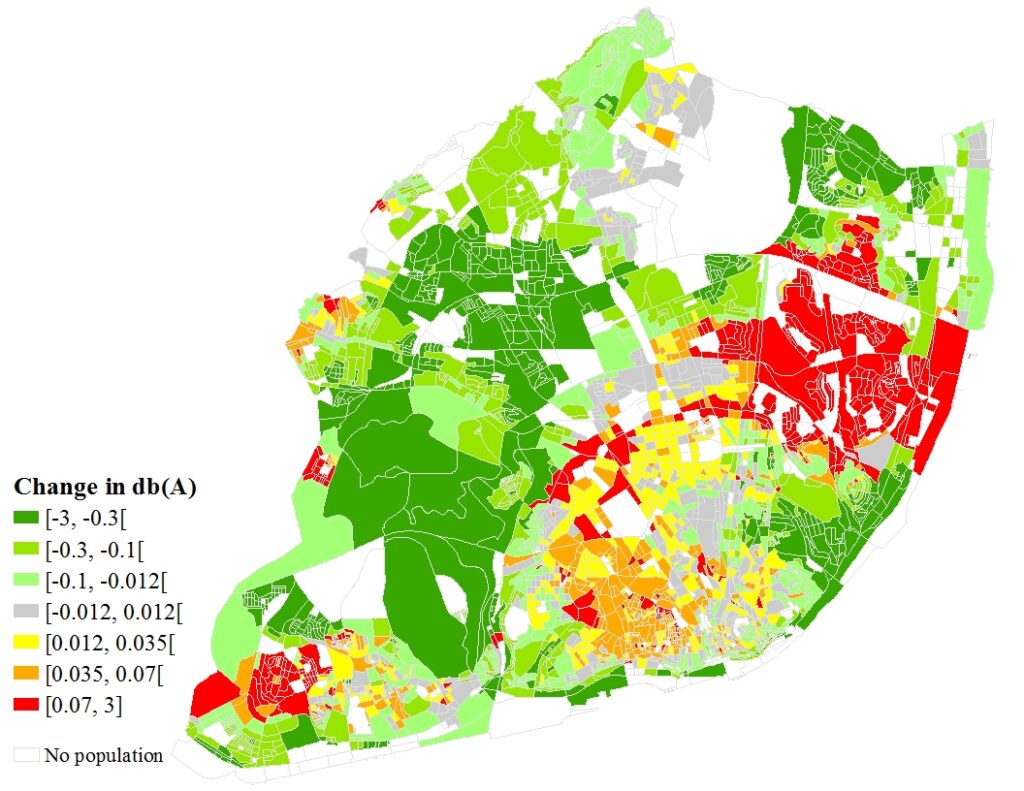
That analysis considered accessibility and exposure to noise at fixed moments in time. A more practical application is to analyse which groups would be affected by a policy. I did that to test the effects of a policy to restrict traffic in the Lisbon city centre. It’s reported in this paper.
The map below shows the forecast of noise exposures after traffic is restricted We would expect to see more green in the map (i.e., noise reductions). But not all drivers respond to the policy by shifting to public transport. Some keep driving, using other roads. So noise increases around those roads (in the East part of the city). The areas where noise increase are mainly low-income.
Example 2: distribution of streetspace
One transport-related resource that generates a lot of conflicts is streetspace, especially in cities. This is because city streets are not very wide, especially in older areas. But many people need to use those streets. And they use them in different ways: for walking, cycling, using a bus or tram, drive a car, park a car or bicycle, stop a taxi, and stop to load/unload goods or make deliveries.
Nowadays there are even more ways of using streets than before, such as e-scooters, shared bicycles, and app-based taxis (also known as ride-hailing vehicles). And there are also ways of using street that are not transport. For example, sitting on benches or at an outdoor café. Or just standing talking to people or looking at shop windows.
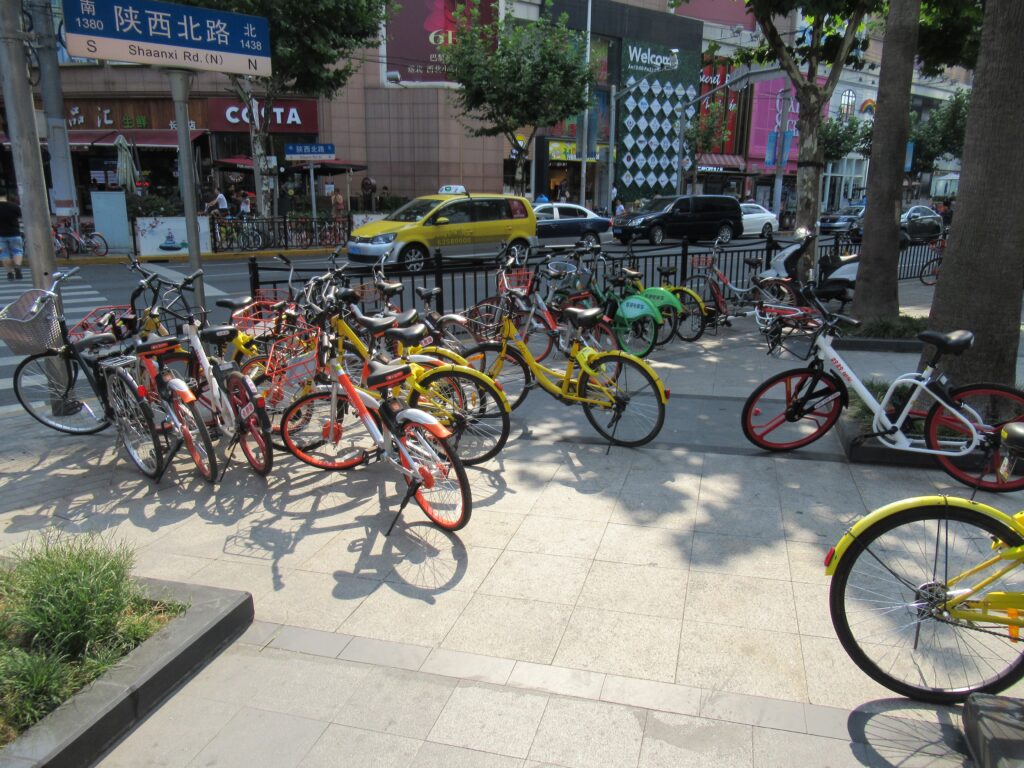
Too many different uses and not enough space means conflicts, i.e., people using space that should be for the use of others. A typical example is cars parked on footways. Another example, more common nowadays, is shared bicycles parked on footways.
The question is: how to distribute streetspace in a way that is equitable? One way to do it is to make the process more inclusive, objective, and transparent. I was involved in MORE, a European project involving universities, companies, local governments and transport authorities, and associations representing cities, pedestrians, cyclists, public transport operators, and freight operators.
We developed a new method that planners can use to find better ways to distribute streetspace. This is done in four steps.
First, generate as many feasible options as possible. We created online tools for that, explained here in this website. This paper explains the tool in more detail. And my Urban Streetspace Book describes everything that can be done to redesign streets.
Second, involve the public. We created a “design toolkit”, with blocks and acetates (representing things like bus lanes, cycle lanes, bus stops, etc.). People can negotiate with each other and create their own new street designs using that toolkit.
Third, model how the street would operate if it had those designs. In MORE, we did that using PTV Vissim. But it could be done with simpler methods. For example, in this paper, I showed how changes in street design could benefit pedestrians, using a busy road in London as an example.
Fourth, judge what is the best design. We also created a tool for that.
We applied this process in five European cities. This paper shows how it was in Lisbon.
Example 3: travel poverty
Equity is not always about the distribution of something. The situation of someone, or a group, can be inequitable even if not compared with the situation of others.
One example is “travel poverty”. This is the situation when someone is not able to access opportunities (for example jobs, health care, recreation) because they lack transport to go there. This means society is not providing for what can be considered a basic right. Which can be judged as inequitable. I worked on this topic in two consultancy projects. They both looked at how policies (by governments or transport operators) can decrease or increase travel poverty.
This report for Transport for the North (a regional transport authority in the UK) used qualitative and quantitative methods to show how travel prevents some people in the North of England to access opportunities and how this could be solved by three policies: better road links, better rail links, and integrated and smart transport. These policies could result in people making more trips, accessing more opportunities. They could even change people’s lives (e.g. change their residence or workplace, selling their car).
In another report, for Transurban (a multinational road operator company), we analysed the possible effect of road pricing on households that rely on car travel to access opportunities in Maryland, USA. The report is confidential so it was not published. But it emphasized how some policies (in this case road pricing) can affect vulnerable groups such as low-income households.